Facts and figures about the ethnic groups in South Australia, to inform anyone involved in Christian mission. Data mostly from the 2021 census.
This is the plain version. If you're reading on a large screen, you can read this article in Mappage with interactive maps and charts.
Click any of the one-letter symbols to see lists, maps & charts. You can often move the mouse around one the map/chart to see more details. You can also see this article in plain form on the GeoMiss site.
Some quick facts
English-only speakers are still a large majority - 81.3% of SA residents in 2021, down from 85.1% in 20111still increasing in absolute numbers.
2.6% of South Australians (44,900) were born in India, up from 1.2% ten years earlier. They are spread among several language groups, the largest being Punjabi. Many Indians here are in their 30s.
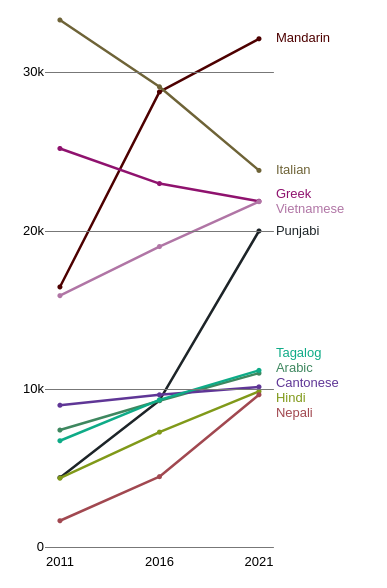
Mandarin is the biggest language other than English, with 1.9% of the population, up from 1.1%. Many Chinese here are uni students.
Italian and Greek are the two language groups in steep decline as the 1950s migrant generation dies. Nearly every other language has increased its numbers.
B topLan The top 10 languages other than English2I've combined Tagalog and Filipino are shown in this chart and together make up 172,000 people. All the other languages add up to 123,000.
Only 42.9% of English speakers in the census identified as Christian, compared with 41.2% for other languages. However, when we look at church attendance, we find that people from non-English-speaking countries are over-represented (NCLS). While most census Christians are not regular church attenders, a larger proportion of census Christians of non-European background will be regular attenders.
B listEnglish34 Only 4.1% of speakers of other languages do not speak English at all and a further 13.3% do not speak English well. This is higher for those who came recently from countries where English is not spoken (eg Afghanistan, Myanmar).
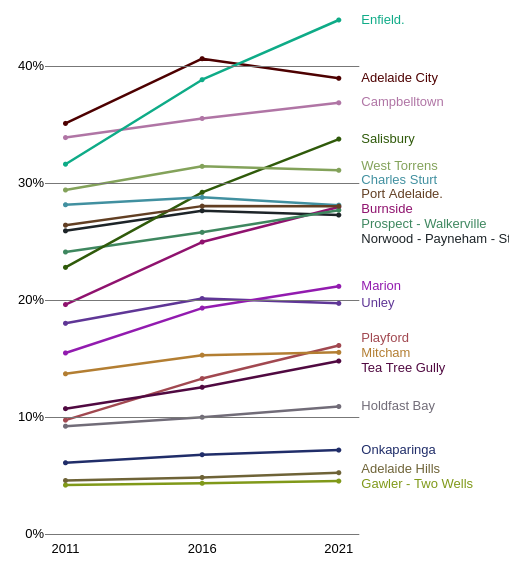
Many ethnic groups are concentrated in inner an northern Adelaide. Onkaparinga, the hills and outside Adelaide are % English-speaking. B sa3Line This chart shows the % of other language speakers in different parts of Adelaide (all those outside Adelaide were under 8%, except for the Outback). Enfield, Salisbury and Burnside had dramatic increases in their proportions, while the western suburbs saw little change.
B steLine Nationally, 76.5% spoke English only. Sydney and Melbourne have much more ethnic diversity than the rest of the country. There's an Adelaide-sized patch in the middle of Sydney3the SA4s of Parramatta, South West and Inner South West that's less than 40% English-only.
Churches
Ethnic minorities are over-represented in the churches in Australia. Many churches that were mostly Anglo-Australian in the past now reflect much of the diversity of the Australian population while there are also many congregations of different ethnic groups and worshipping in many languages.
Note that this section refers to maps you can't see in here the plain version - they're in the Mappage version.
D all This map shows over 200 local churches where the church, or a congregation of it, are largely from an ethnic minority. Colours represent region of origin. There are many more groups I didn't include that meet only monthly. There are more still that I don't know about. Much of the information there is vague (rather than trying to specify what I don't know) - the groups shown here might worship in English, another language or both; they might be a standalone congregation or part of a larger church; the information could be outdated. Sometimes I've indicated a language, sometimes an ethnicity, sometimes an ecclesial group.
I'm also aware that such a map tells only part of the story in that large numbers of migrants are part of the other churches. So even if there isn't a church in SA of a particular language or nationality, there may still be Christians in that group scattered through a few local churches. That said, this map still represents a significant part of the body of Christ in South Australia so I like to show it. The links below show them broken down by region of origin. They're coloured by the major denominations, with the largest group (light blue) being those not of one of the main denominations.
D meca Middle Eastern: There are several Arabic churches4or churches with people from Arabic-speaking countries; I couldn't always tell, some Farsi.
D sas Indian & other south Asian: Many Malayalam churches. A few Tamil and other other Indian & Sri Lankan groups. A group of Nepali-speaking Bhutanese churches in Playford.
D bur Burmese: Many of the Burmese ethnic groups are majority Christian and several have congregations in Adelaide, many of them baptist.
D chi Chinese: Many churches.
D kor Korean: Several churches. While South Korea is more (practising) Christian than Australia, Koreans in Australia are much more likely to be Christian5or at least I read something to that effect from 20 years ago.
D eas Other Asian: Vietnamese, Filipino, Indonesian, Cambodian, Japanese.
D ab Aboriginal: Some in Adelaide; many more in remote areas that I haven't detailed.
D is Islander: Tongan, Fijian, Samoan, Maori and others.
D af African: Many Sudanese, Burundian. Congolese, west African, Zimbabwean, Nigerian, Eritrean, Ethiopian. Many are pentecostal. Many are in the Elizabeth area and I only came across some of them because I lived there, so I wonder how many similar independent churches (African or otherwise) in the rest of Adelaide are there that I didn't notice.
D yu Croatian, Macedonian, Serbian.
D it Italian: Many Catholic churches and some others.
D gr Greek: Many Orthodox churches and some others.
D eu Other European: Several Polish, Russian. Romanian, Bulgarian, Ukrainian, German, Spanish, Portuguese, Hungarian, Lithuanian, Latin and others.
This page shows all the churches in my database. You can tell me about any I've missed6or add it to the map yourself, but I've failed to make it user-friendly. One data source worth acknowledging is the Adelaide Catholic list of multicultural mass times 7many of which weren't included in my map because they only meet monthly.
All the statistics
To see lots of detailed statistics on any ethnic group, go to the Mappage version of this article, where you can see lots of details about any ethnic group. It's best viewed with a larger screen. Even on a phone the lists and line graphs will be readable, if not the maps and other charts.
Here are a few more lists of numbers before we get too complicated.
B listLang Number of speakers of each language
B listLangSince The same, but just those who arrived since 2010
B listBpl Number of people from each country of birth
B listBplSince The same, but just those who arrived since 2010
B topBpl Some of the top countries of birth and how many people from there over time
Now some more complicated stuff for those interested. Mappage was designed to allow maximum options for looking at data rather than ease of use, so I hope you can find what you want, so sorry if it's too tricky. Also sorry if you're on a smartphone, because you need a bigger screen for most of what follows.
Earlier versions of this article listed the numbers of over a hundred language & birthplace groups, with a few different maps/charts available for each. I've simplified this by listing a whole lot of links here once rather than for each language. Still, If after changing a few different things it seems not to work, refresh this page and try again.
For stats on the speakers of a particular language:
Click one of the links below.
Click "Language" on the right.
Choose a language from the list, either by clicking '+' to expand the list or by typing into the search box.
That will show details relating to that language. You can then click other one of the links below to see other stats relating to that language, or choose a different language and see the corresponding data.
B lanLine Number of speakers 2011-2021
B lanAge Age profile
B lanMap Map showing the proportion of residents speaking that language
B lanRel Religion pie chart
B lanBpl Country of birth pie chart
B lanStack Population broken down by age and year of migration
Similarly, for stats on people from a particular country of birth, click any of the links below. Click "Birthplace" and choose the country from the list.
B bpLines Number of people 2011-2021, as well as number of people whose parents were born in that country
B bplAge Age profile
B bplMap Map showing the proportion of residents born there
B bplRel Religion pie chart
B bplLan Language spoken at home pie chart
B bplStack Population broken down by age and year of migration
For stats on the residents of some area in the state8or even elsewhere in Australia, click one of the links below. Click Residence and choose an area from the list.
B urLan Language spoken at home pie chart
B urBpl Country of birth spoken at home pie chart
See also QuickStats (ABS). A whole lot of different details on the residents of any area in Australia.9This article is basically an attempt to provide a QuickStats-like feature but based on language/birthplace rather than area.
These maps take a while to load:
B mapHiLan Map showing the most common language other than English
B mapHiBpl Map showing the most common country of birth other than Australia
More
If anyone wants more details on anything - info about churches in SA, ABS data or anything in between - ask me and I'll dig up the detail available. the ABS website (QuickStats, Table Builder etc) has lots of census data in different forms.
I wrote this first in 2015 and updated it in 2019. Then it was a 3,500-word reference document detailing over a hundred language & birthplace groups, with links to charts along with information about any churches in SA of each group. I'm not as knowledgeable about the churches as I was in 2019, so any similar list I wrote will be less complete than it was then. For that reason, as well as to keep this shorter (and allow many more visualisations, and just get it finished!) I gave up on a detailed catalogue of ethnic groups.
The marker of ethnicity I refer to most is "Language spoken at home". If a person speaks English and another language, it's the other one that counts. Language groups can grow both by immigration and by children of the migrants being born here. I sometimes use "Country of birth". The census also includes Ancestry, but I haven't used it. Apart from the census there are migration statistics that I haven't used.
I'm writing three years after the 2021 census 10to my great frustration - I wanted to get this done long agom and you may be reading later again, so some numbers will have grown further. Many of those recently arrived will leave again soon (eg students) but many stay. Some people move to SA from overseas and later move interstate. It's hard to follow all the flows of people.
The churches started by last century's migrants now have generations of English speakers and many aspire to be a church for anyone in their community11Including my local church - historically Chinese, but now quite mixed., the same as outward-looking originally Anglo churches do. In fact this is true even of more recent migrants. As part of a research project with Uniting Church SA in 2021-22 I talked with pastors of African churches. They shared aspirations that people of any background would join their churches. They have a long way to go, but they're a significant part of the present and future of the Church in our state.
Some percentages here may differ from other sources because I often remove "Not stated" from the denominator.
See the GeoMiss site for more on statistics, geography & Christian mission. See the Mappage contents page (link back at the top) for more about this web app.